Publicado el 07/06/2024
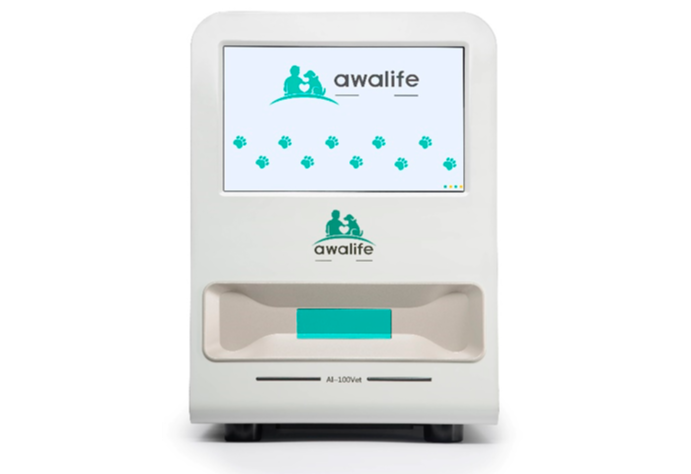
RAL presents the new AWALIFE AI-100Vet image morphology analyzer.
The AWALIFE AI-100Vet is an image detection system. It uses images obtained by microscopy thanks to an automated staining mechanism and analyzes them to detect not only the cellular composition, but also other parameters of the blood count. All this is possible thanks to software with artificial intelligence that allows you to analyze the images and generate a report interpreting the cells and other parameters present in the sample. Likewise, the software will be updated regularly “learning” thanks to the results obtained.
Additionally, this is the first analyzer to offer interpretation of results and diagnostic indications.
It is an innovative and unique product on the market. Currently there are some analyzers with similar characteristics, but none as complete as the AWALIFE AI-100Vet.

Analyzer and operation
The AWALIFE AI-100Vet allows 4 types of samples to be analyzed in one system.
Blood – Blood Count and Smear
Urine – Sediment
Feces
Ascitic fluid
In a few minutes, results are obtained on screen with a detailed report.
Test Cards
Dual test cards are used for sample analysis. That is, each card serves for 2 samples since it has 2 channels (left and right).

The cards are identified with the corresponding test/sample type. In none of them are there cards that are used for different types of samples.
The first channel used is always the left channel (indicated when performing the test on the analyzer). The right channel is covered with a blue film that must be removed at the time of the second test.
The pipettes required for the samples are included with the analyzer.
BLOOD – BLOOD COUNT AND SMEAR
The AI-100Vet allows for more hematology results than any other analyzer. It is the only system that allows obtaining both the blood count and the detailed analysis of a smear analyzed under a microscope.
This includes counting for:
- Neutrophils in band
- Segmented and hyper-segmented neutrophils
- Reticulocytes
- Nucleated red blood cells
- Large platelets
- Platelet aggregates
Segmented neutrophils and band neutrophils distinguish between inflammation and bone marrow regeneration. Band neutrophils are immature neutrophils and indicate acute infection. Hypersegmented neutrophils are old neutrophils and are indicators of chronic infections, vitamin B12 deficiency, and high folic or corticosteroids.
Reticulocytes are used to identify types of anemia. Phantom red blood cells can be used to evaluate intravascular hemolysis
Large platelets are indicators of platelet regeneration and platelet aggregates allow the platelet count to be corrected with respect to that obtained with impedance or laser. Platelet aggregates are usually cause for having to do a smear because they can make it look like there are low platelets in traditional analyzers because they do not detect those that are aggregated.
With just 10μl of blood, images of up to 500,000 cells are captured thanks to the capture of images of more than 600 fields in 6 minutes. In addition, it uses phase contrast to detect parameters such as hemoglobin. Awalife technology distributes the sample into a single layer of cells for imaging and counting.
Results Report - Blood
Once the analysis is complete, the results report will appear on the screen:

In the first part we have a report like that of the traditional hematology analyzers with the white, red and platelet series.
Results that are above or below the reference range are indicated in colour.
Next, we have 3 charts
- Platelet/red blood cell distribution.
- Distribution of red blood cells. It shows the average hemoglobin content with respect to size.
- Red blood cell differential. It shows the average hemoglobin concentration with respect to size.

Below, we have the detail of the images of each cell type with a model and some real cells of the analyzed sample

In addition to this we can see the situation of each cell in the general field image:

In addition to the images shown in the report, the software saves all the images obtained from the last 20 samples for reference. After that, only the images included in the report will be saved.
Diagnosis – Blood
Finally, we have a diagnostic report. It indicates all the altered parameters and what clinical significance they may have, depending on the alteration, and in conjunction with other alterations present in the sample.

These diagnostic indications can be deactivated individually or completely in each report.
Species - Blood
Species such as dogs, cats and other mammals are included in the analyzer. In the case of mammals that do not appear, they can be analyzed anyway, the only difference is that normal values do not appear.
URINE – SEDIMENT
With the AI-100Vet we can get results in 10 minutes with minimal sample preparation time.
It detects crystals, cylinders, cells and germs in addition to other parameters such as fat droplets or mucus.
Analyzes more than 1000 fields to improve detection over other analyzers.
Parameters analyzed - Urine
Cylinders: Hyaline, Cellular, Granular, Waxy
Crystals: Estruvites, Oxalate calcium mono hydrate, Calcium oxalate di hydrate, Calcium carbonate, uric acid, Cystine. (I'll add xantine's crystals soon.)
Cells: Tubular renal epithelial cells, Squamous epithelial cells, Transitional epithelial cells, Sperm
Germs: Cocci, Bacilli, Yeasts
Others: Fat droplets, Mucus
Parameters not included in this list may be detected and marked as unidentified.
Results Report – Urine
Once the analysis is complete, the results report will appear on the screen:

First, we obtain a summary of the results, with reference ranges and results in the form of negative and positivity ranges as well as numerical values in μl and HPF (fields at 400x magnification).
Diagnosis – Urine
Next, we get the diagnostic report. As in the case of blood, it is customizable.

Finally, we get field images and the individual images sorted according to the type of parameter found.

Species - Urine
Species such as Dog and Cat are included in the analyzer. In the case of species that do not appear, they can be analyzed anyway, the only difference is that normal values do not appear.
FECES
As with urine, we get stool results in 10 minutes.
Report more than 30 parameters with images.
Suspected parasite eggs are indicated on an individual basis so that the veterinarian can assess them.
Analyzes more than 1000 fields to improve detection over other analyzers.
Parameters analyzed - Stool
Parasytes (huevos): Ascaris áscaris, Anquilostoma, Tenia, Dipylidium caninum, Sppirometra, Alaria alata
Intestinal protozoa: Trichomonas, Giardia lamblia, Isosporium coccidia (different states)
Germs: Cocci, Bacilli, Brevibacterium, Anaerofilum, Campylobacter, Spirochetes, Helicobacter, Yeasts
Cells: Red blood cells, leukocytes, epithelial cells
Digestive function: Starch granules, Fat drops, Vegetable fibers, Muscle fibers
Results Report – Feces
At the end of the analysis, the results appear on the screen.

In the first part we have a screen similar to the previous ones with results in absolute value and by field (HPF or LPF)
The report with the diagnostic indications according to the results obtained is then displayed.

Finally, we obtain general field images and finally the classified individual cells. If you do not recognize an item, it is shown as unrecognized.

Species – Feces
The species available for stool samples are Cat and Dog.
LIQUIDO ASCÍTICO
El procesado de muestras de líquido ascítico estará disponible en verano mediante una actualización de software.